In this article
Challenges designing for the Circular Economy
PixelEdge Solution
Results
Selected Features
Contact PixelEdge
Challenges designing for the Circular Economy
As the idea of environmental sustainability grows to include impacts on everything from greenhouse gasses to mining to transportation to water usage, product companies struggle to assess sustainability benchmarks and measure progress against them.
Circularity is a new way of looking at “greening” a business. The Circularity Gap Report, published in 2022 by Circle Economy, notes that only 8.6% of the world’s resources are cycled during the year. The remaining amount, more than 90%, is extracted from the earth and typically goes through a linear “take-make-waste” cycle. There isn’t yet an international standard for assessing circular economy metrics, but several organizations and governments have set up guidance.
“EcoX”, a circular economy consulting company, had product development clients working with them on greening their business. One company, “ClientY” had even incorporated circular economy metrics into the bonus structure for their CEO. There were no tools on the market that could show how a product performed in terms of the circular economy, or how to assess changes to the product life cycle that would affect sustainability objectives.
The challenge was to combine many fragmented recommendations for different parts of a product manufacturing and disposal processes and to create actionable metrics and policies that could show progress using a scoring system that was easy to understand.
To assist ClientY, EcoX consultants used a time-intensive process to build custom spreadsheets to score impacts on the circular economy based on the metrics that ClientY wanted to assess. ClientY then used these spreadsheets to create a web-based application, but it stopped short of the vision they had for circular economy metrics.
EcoX wanted to be able to offer a robust solution to assess the circular economy metrics for its product development markets. They were well known in the sustainability space and wanted to create assessments efficiently, with a tool that could grow and change with the evolving specifications and recommendations in the industry. They wanted to tell their clients how they could make their products stand out as examples of sustainability.
PixelEdge Solution
PixelEdge knows that things change. In this case, many organizations were creating voluntary guidance for different industries and organizations. Some outlined broad recommendations and others focused on specific topics such as water use and greenhouse gas emissions. To assess the impact of decisions on the entire product lifecycle, from sourcing materials through disposal a product design, needs to be considered:
- Product design
- Product development
- Materials sourcing
- Manufacturing
- Packaging
- Transportation
- Distribution
- Sales and marketing
- Product use
- Product disposal
PixelEdge created a questions-based model that included:
Item
Description
Sections
Individual parts of a process, like manufacturing or product disposal. Each section can be weighted according to its importance to the process.
Questions and answers
Questions can be generic, or based on a particular standard, such as the European Sustainability Reporting Standards (ESRS). There can be a number of answers, and each can be assigned a specific score.
Principles
These are circular economy principles, such as recycling, water usage, and greenhouse gas emissions.
Engineers design a model for a client that includes questions and answers divided into each section, and one or more principles assigned to each section. The client and engineers then work together to answer the questions.
After answering the questions, results can be reviewed on a dashboard, including a total score and specific principles. The circles are normalized to 100%, even when changing weighting for a section, updating answer values, or adding new questions.
For example, a company is making a jigsaw. They create a baseline and see that they have several opportunities to improve their circular economy metrics.
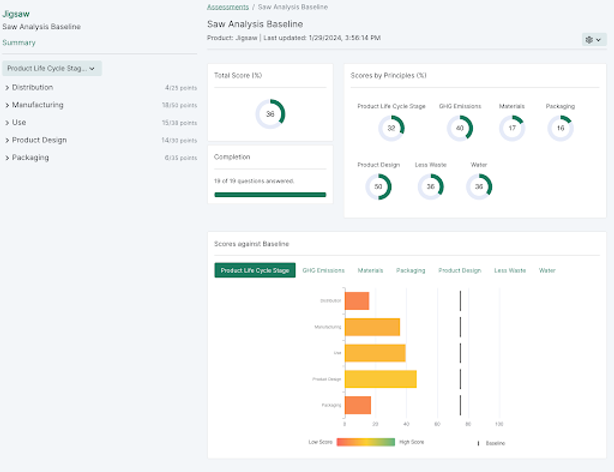
Sample Dashboard
They review each category and redesign the product with their circular economy metrics as a priority, and can compare their design across the individual principles.
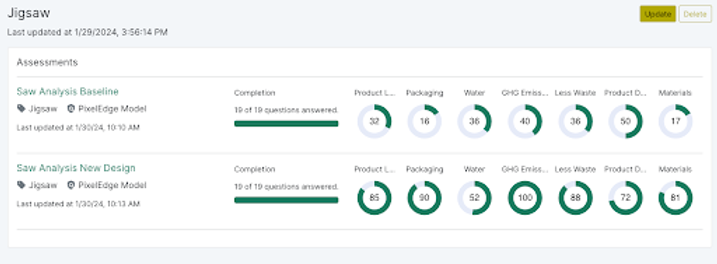
Comparing the individual principles scores before and after changes
For each principle, they can review the individual sections for improvement and whether they reached their target goals.

Comparison of Baseline versus New Design
In this example, the final dashboard looks like this, with most criteria exceeding the target goal.
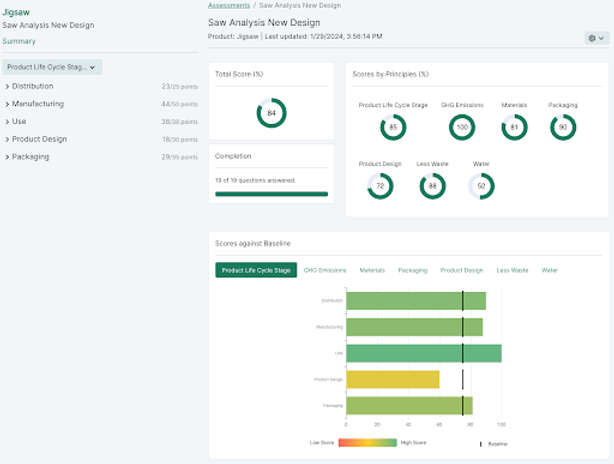
New Design dashboard
With customizable question-and-answer banks, the data model can easily be updated for new and updated regulations, or it could be expanded into more detail based on client priorities. Sections of questions can be added for additional parts of the product cycle.
With clear visualizations that help you easily compare circular economy metrics based on design decisions, anyone in engineering, product management, sales and marketing, or the C-suite can look at the scores to see the impact of their decisions and priorities. Because the information is scored in stages of development, each with its individual categories, companies can easily see where to improve or can showcase their results.
Results
PixelEdge created an app with flexibility designed into it and included reusable models as templates for specific industries. In an industry with constant change, the flexibility of the interface made it easy to work with different regulations and guidance from trusted organizations.
The app made it easy to assess and communicate metrics for the circular economy. Changes to a process show up immediately in the data visualizations, allowing engineers to view the real-time effects of their updates. The tool allows for quality data visualizations that could be shared with project managers up through CEOs, including those on both the business and technical sides, so that they can see the impact of their decisions on the circular economy. These visualizations allow them to showcase their successes to customers, governments, and the general public.
